![]()
AC current sensor explanation2(View point for coupling efficiency (K) characteristics)
Output voltage calculation
Eo=K·Io·RL/n
Eo:Output voltage………(Vrms)
K :Coupling efficiency
Io:Penetrated current………(Arms)
RL:External load resistor…(Ω)
n :Turns…………(turns)
At the calculation above, (K=1) is the ideal CT.
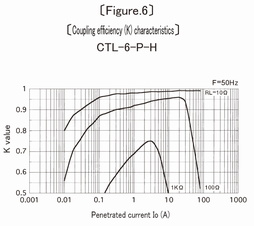
Actually, the coupling of CT is changed by the variable reason such as the change of the exciting current, leakage magnetic field, pearmeability, and soon. This is defined totally as the CT's coupling efficiency (K value), and the one which expressed as the change of it with the usage condition is the coupling efficiency (K) characteristics as [Figure.6] and [Figure.7].
With this characteristic, each CT's usage range, accuracy, linearity, and soon, can be gotten more accurately.
The points which the coupling efficiency (K) characteristics explain
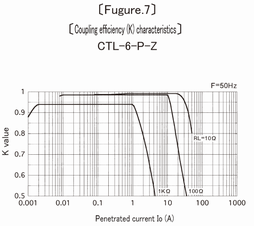
·It is close to the ideal CT with lower value for the load resistor.
·The output of CTL general series [Figure.6] is not saturated with higher current than CTL-Z series.
·CTL-Z series [Figure.7] is getting flat characteristic until the lower current area as the wide range.
·It is hopeful to decide the usage condition with the criteria above 0.9 for (K) value, for the linear application to get the analog output.
·In the case to get the high output voltage with the high load resistor for the current detection application, CT is often used in the output saturated area at the right side of characteristics.
In this case, it is depended on the variation of the core's material, and soon. Because it makes the individual difference frequently, the enough margin is necessary to decide the operating point.
Different view point of the characteristics
Based on the (K) characteristics as [Figure.6] and [Figure.7] , the lower characteristic can be seen not only at the high current and saturation area, but also at the small current area. However, this expression is the ratio error between the ideal value and actual value in each measuring point, so the value of the error, itself, becomes lower with lower current. Thus, the linearity toward full scale accuracy which is the issue in the common linear application, can get good enough characteristic.
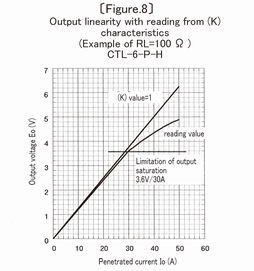
[Figure.8] is the output voltage graph to be gotten by the calculation of Eo=K·.5Io·RL/n with reading (K) value from the (K) characteristics.
It expresses to get the good output linearity and accuracy with selection of the applied current range and load resistor within the limitation of output saturation.
![]()
![]()
![]()
![]()
![]()